Oscilloscope pictures
Lissajous Curve
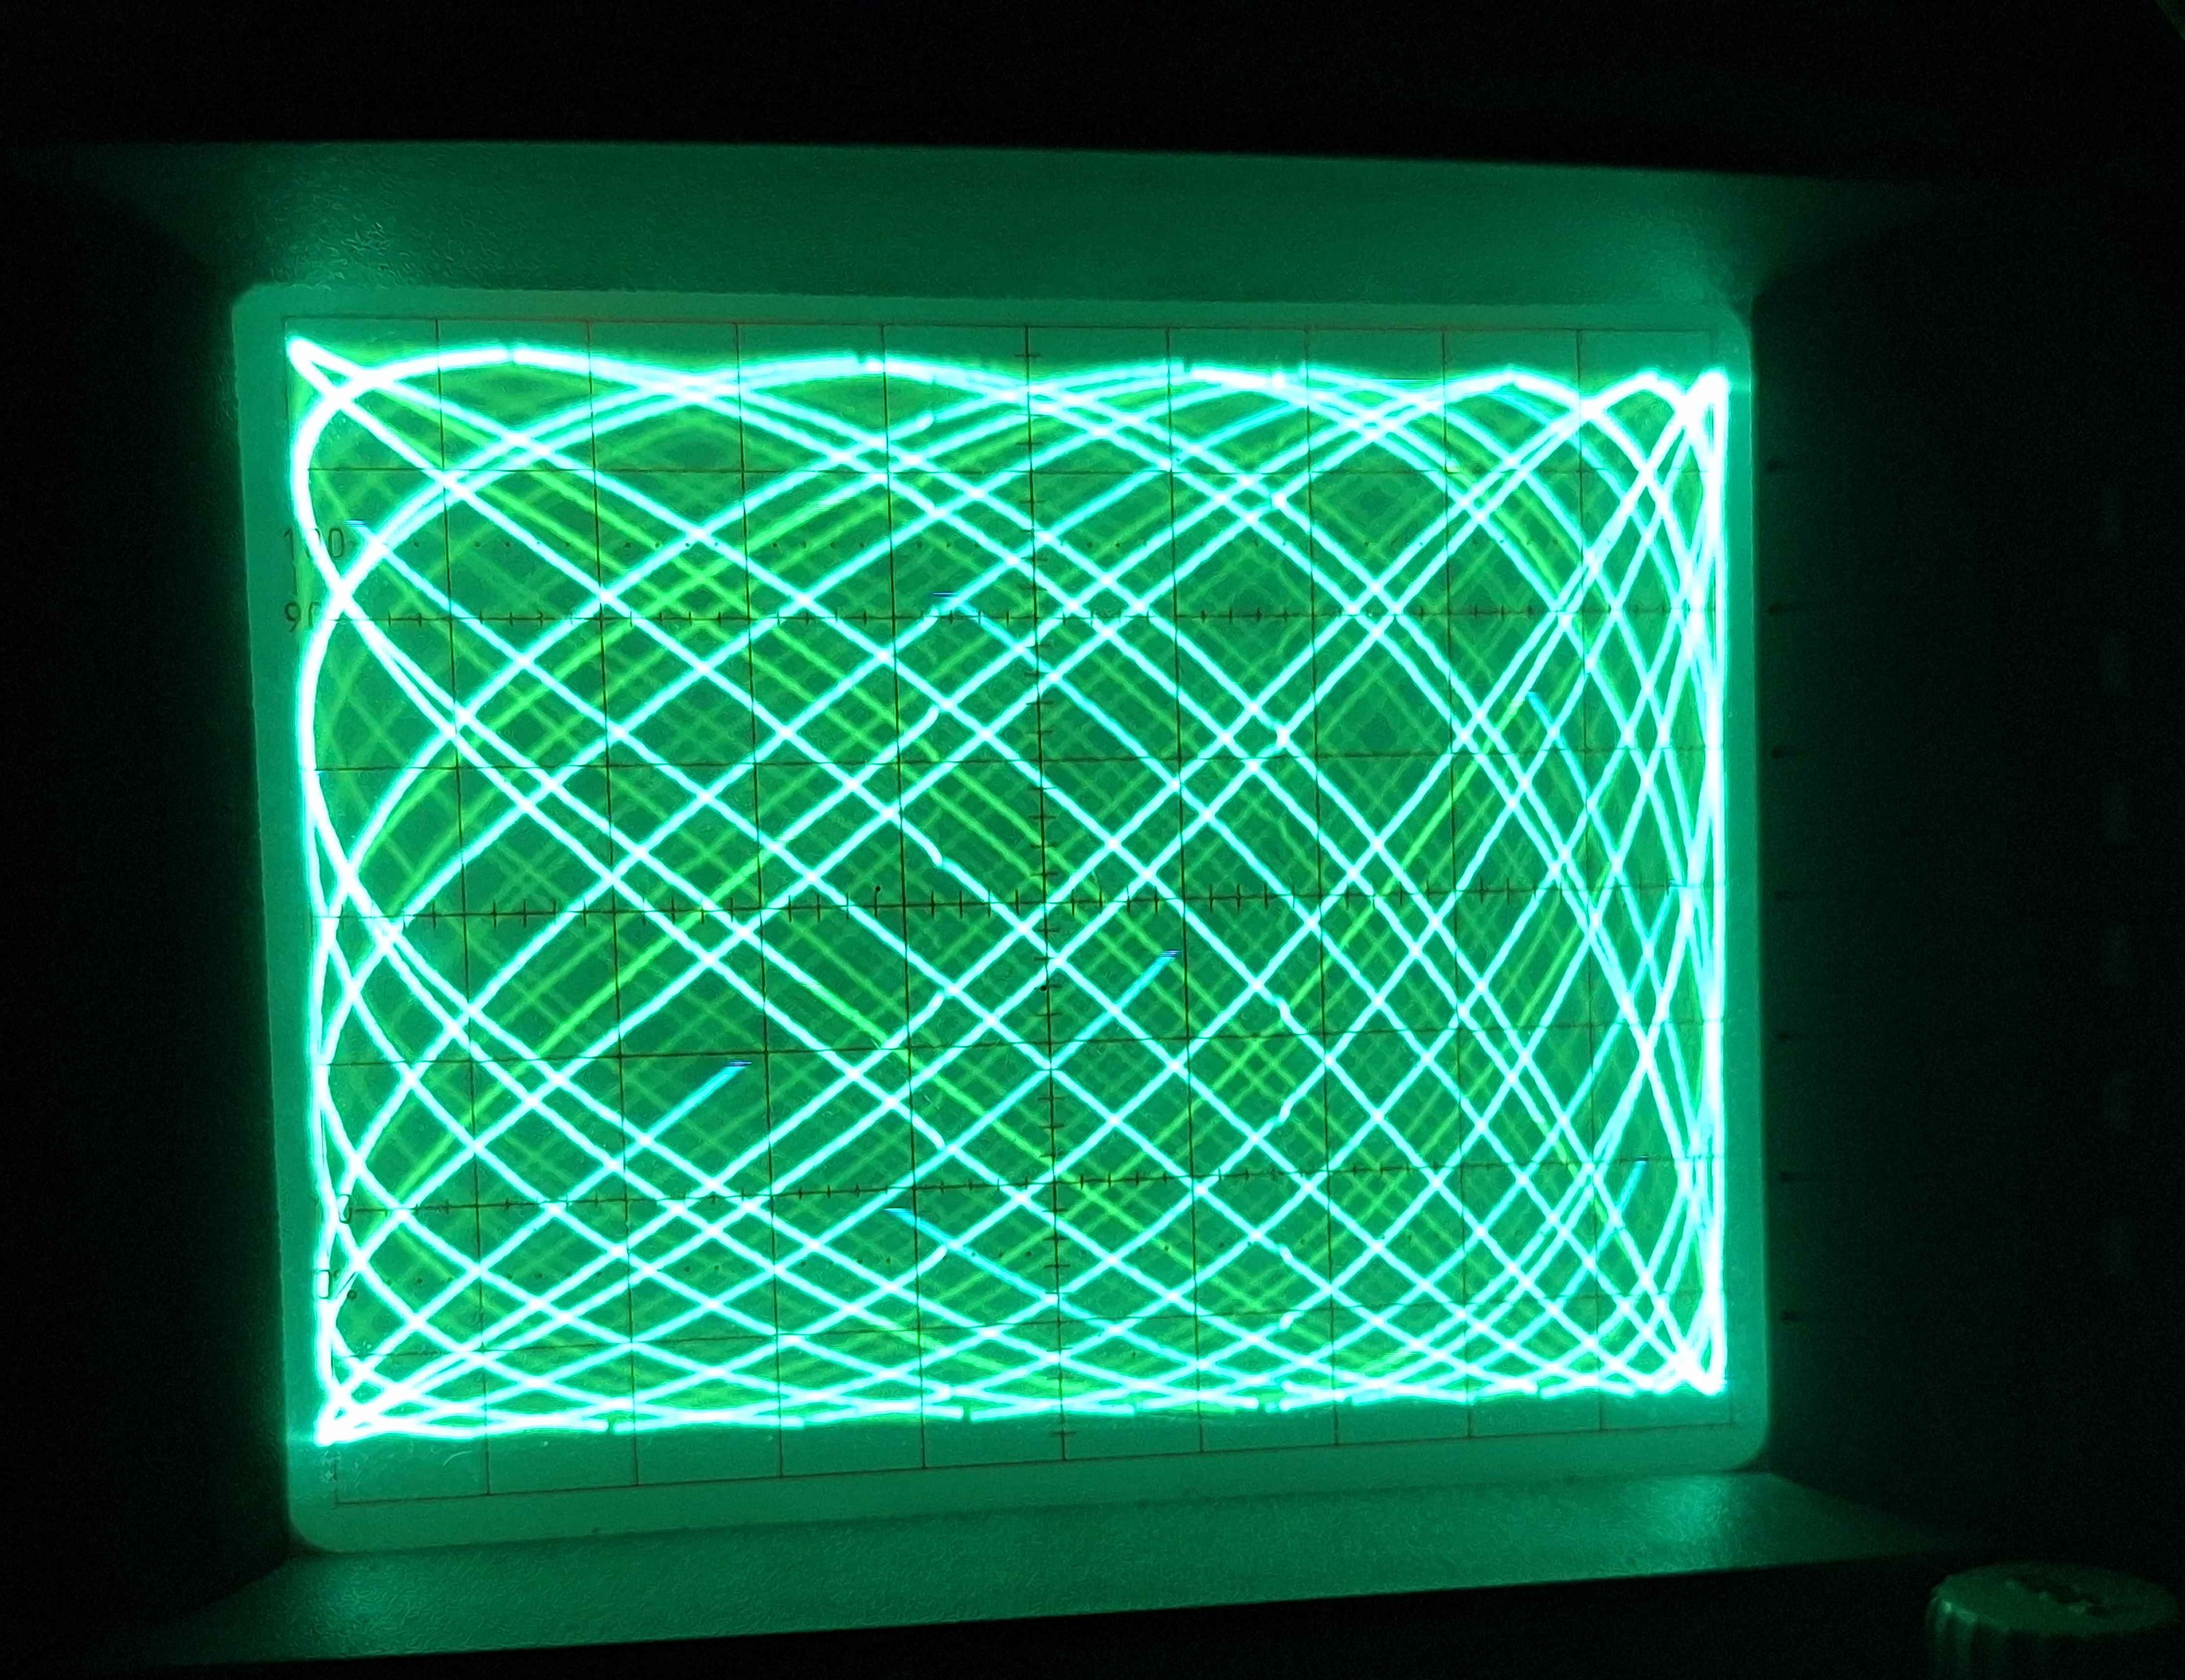
In this picture is a Lissajous Curve. Typically, it's made by plotting two sine curves against each other.
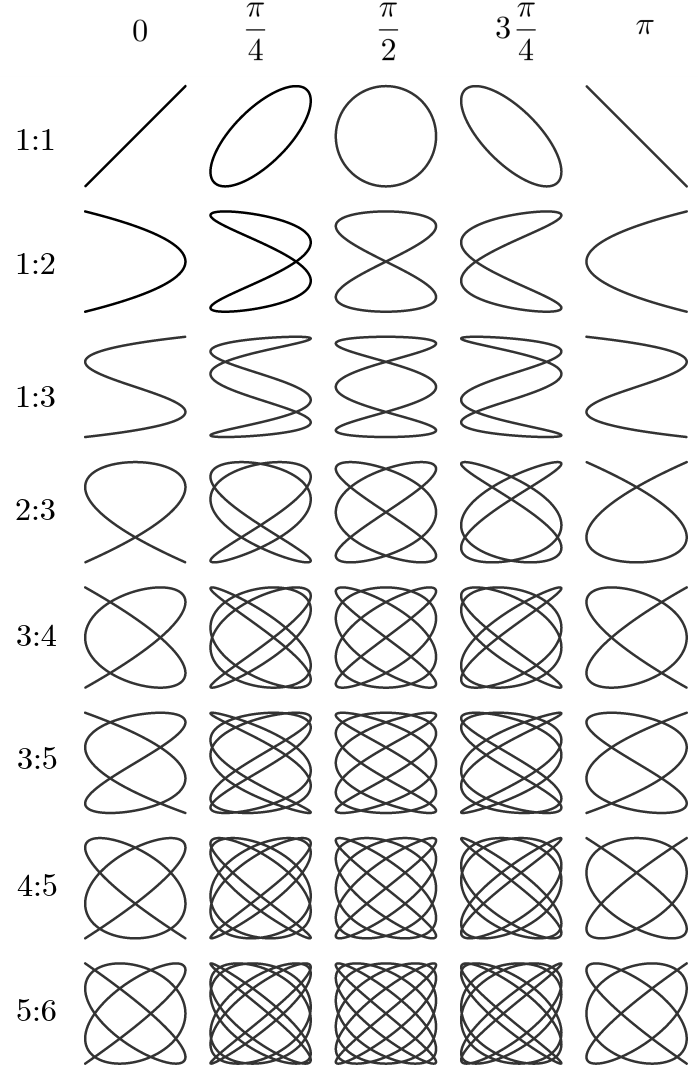
In this case (1) it's made with a 400Hz sine Curve for the x-axis and a 500Hz sine wave as the y-axis. The resulting 5/4 relation shows a Pattern that can be compared with a diagram (2)